TIL: analysing my strava data
i have been using strava to record my runs, walks and cycle rides since feb 2021 - so has been 5 years now. i don’t record gym sessions in strava so it’s just my cardio data. an llm gave me the idea of exporting my strava data. was simple and fast to download the archive from strava.com
now unlike earlier times - this time i’ve decided to do the analysis on my own, without any ai help. ai will obviously do it faster but i’m better off doing it on my own - i’ll learn more this way. i’ve already learnt how to use ai for data analysis and that it can do it very fast and accurately.
whats interesting is that doing it myself now is not the path of least resistance. the path of least resistance is to use an llm. its faster and will take up less of my cognitive energy. which if we extrapolate to organisations is daunting - that for white collar tasks that future ai will do accurately and faster than humans - the best short term strategy for organisations is to just let ai do it. humans will be slower and expensive. and if for a period of time humans stop doing some intellectual task - neuroplasticity will make them forget it. now whats sure is that ai will infact produce new kinds of jobs - what we don’t know is the ratio of the jobs it’ll create to the ones it’ll make redundant.
philosophy aside, lets do the analysis.
the activities file is in .xls format and we’ll stick to it since my excel is stronger than my python thanks to the statutory audit days at deloitte.
- first basic finding
| Activity Type | Count |
|---|---|
| Hike | 3 |
| Ride | 62 |
| Run | 122 |
| Walk | 62 |
Total activities: 249
- i’ve been thinking lately about how my jogging pace hasn’t improved much over the years and was kind of disappointed - this data now tells me why.
- i’ve only done cardio for 249 days in a period of 5 years. my current pace now seems good to me after seeing the data.
what took longer than i expected (around 10-15 minutes was cleaning the date column which had both date and time. i used the delimiter text to column first which didn’t work out. the fixed width method worked immediately.
- year wise distance covered
| Year | Total Distance (km) |
|---|---|
| 2021 | 575.63 |
| 2022 | 260.77 |
| 2023 | 190.81 |
| 2024 | 251.96 |
| 2025 | 186.73 |
| 2026 | 19.58 |
Total Distance (All Years): 1485.48
- this is interesting. (sidenote - i should probably guess the analytics before i see them.)
-
i did strength training at the gym nov 2024 through july 2025 which means that 2022 and 2023 were the poor years.
- made a area chart of qtr vs distance on excel and that made me realise that 2021 i did a lot of cycling and it’s defintely not right comparing cycling distance with jogging distance.
- need to normalise it to make it comparable
normalising distance - and this is based on my personal experience - i’m using 1km jogging = 3km cycling and since i’ve jogged more, i’ll convert the cycling distances * 1/3 for normalisation.
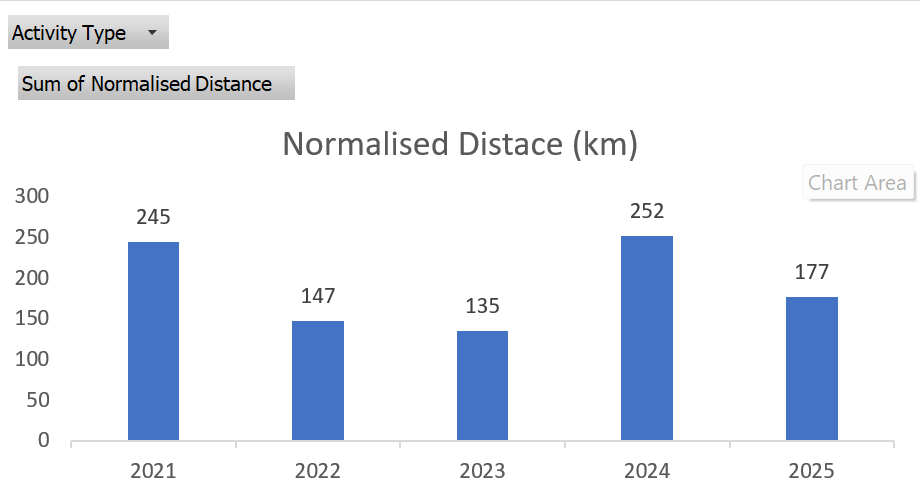
after normalisation, what we get is
| Year | Normalised Distance (km) |
|---|---|
| 2021 | 245 |
| 2022 | 147 |
| 2023 | 135 |
| 2024 | 252 |
| 2025 | 177 |
| 2026 | 20 |
Total Normalised Distance (All Years): 975.52km
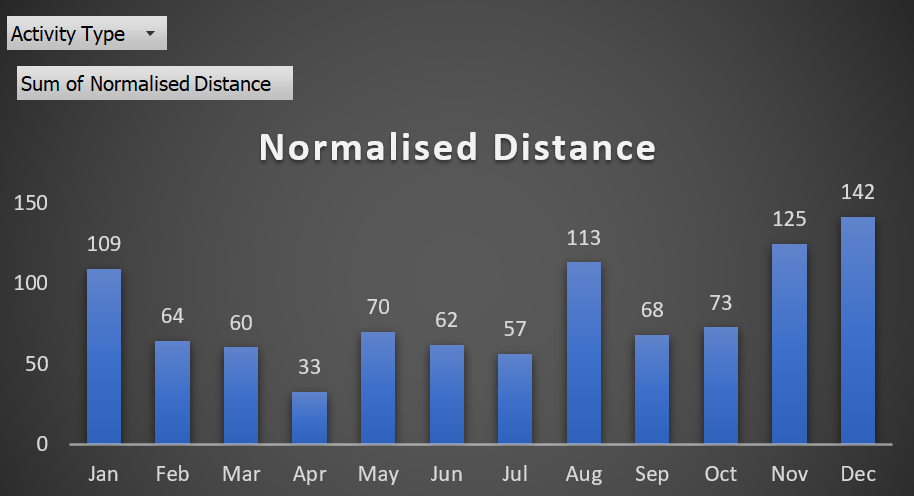
if we do month vs distance, we get an interesting graph
-
we get peaks at nov - jan and a peak at august. its probably just randomness since the sample (250 activities over 5 years) isn’t significant enough. or maybe there are reasons that my brain just can’t think of. interesting nonetheless.
- wow. i seem to have found something awe-like. this is what luck surface area is all about.
-
so there’s a column in the strava dataset called Filename and the filenames are formatted as “activities/4725964075.gpx”. the data was in chronologically ascending order and i immediately noticed how the numbers in the filenames were increasing monotonically. i realised that it might the case that strava generates a sequential filename basis the time that activity is logged on their servers. so if i log an activity at 8AM and someone else in some other part of the world logs in their activity just a second later, their filename will have my number+1. so what this means is that i can find out the total number of activities logged throughout the world on strava between any 2 of my activities.
- finding out the daily average number of activities logged on strava
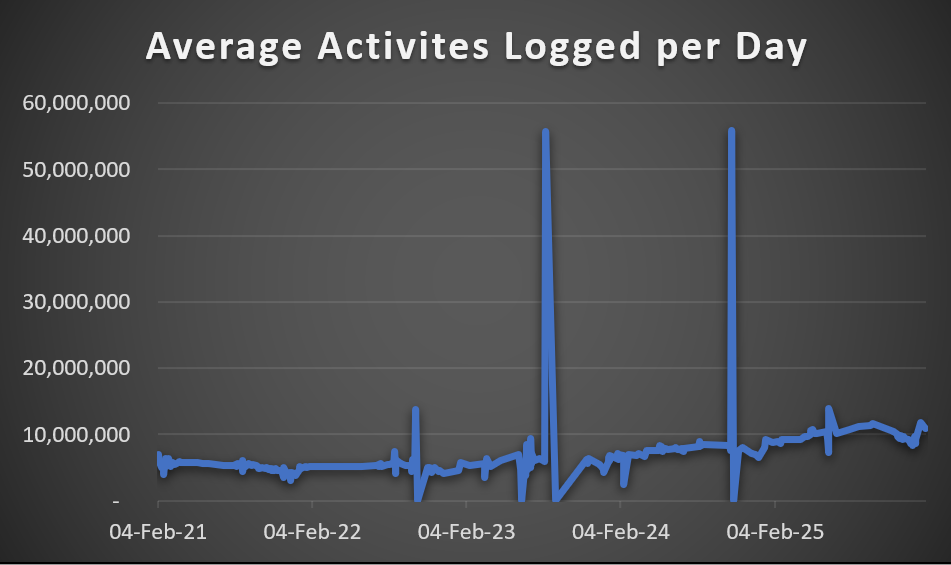
- a very interesting graph. there are a couple of major outliers (will need to look into what causes them) but otherwise it looks correct. there were around 5million/50lakh activities logged on strava per day in 2021/22 and then it has grown to around 10million/1crore activities per day in 2025/26.
multiple further analysis needs to be done but sleep is important as well, so we’ll continue tomorrow.